An unseen event can become an incident discovered too late.
Logs spread across many servers slow down the search and complicate the reconstruction of what happened.
A live event dashboard, searchable fleet logs and self-hosted push alerts notify you as soon as something happens. The core stays in your infrastructure; sending emails uses only the optional SMTP server you configure.
Logs spread across many servers slow down the search and complicate the reconstruction of what happened.
The dashboard provides one view, while push alerts notify you immediately when attention is needed.
Filter the event, reconstruct the sequence and check from which server the event started.
Live event dashboard
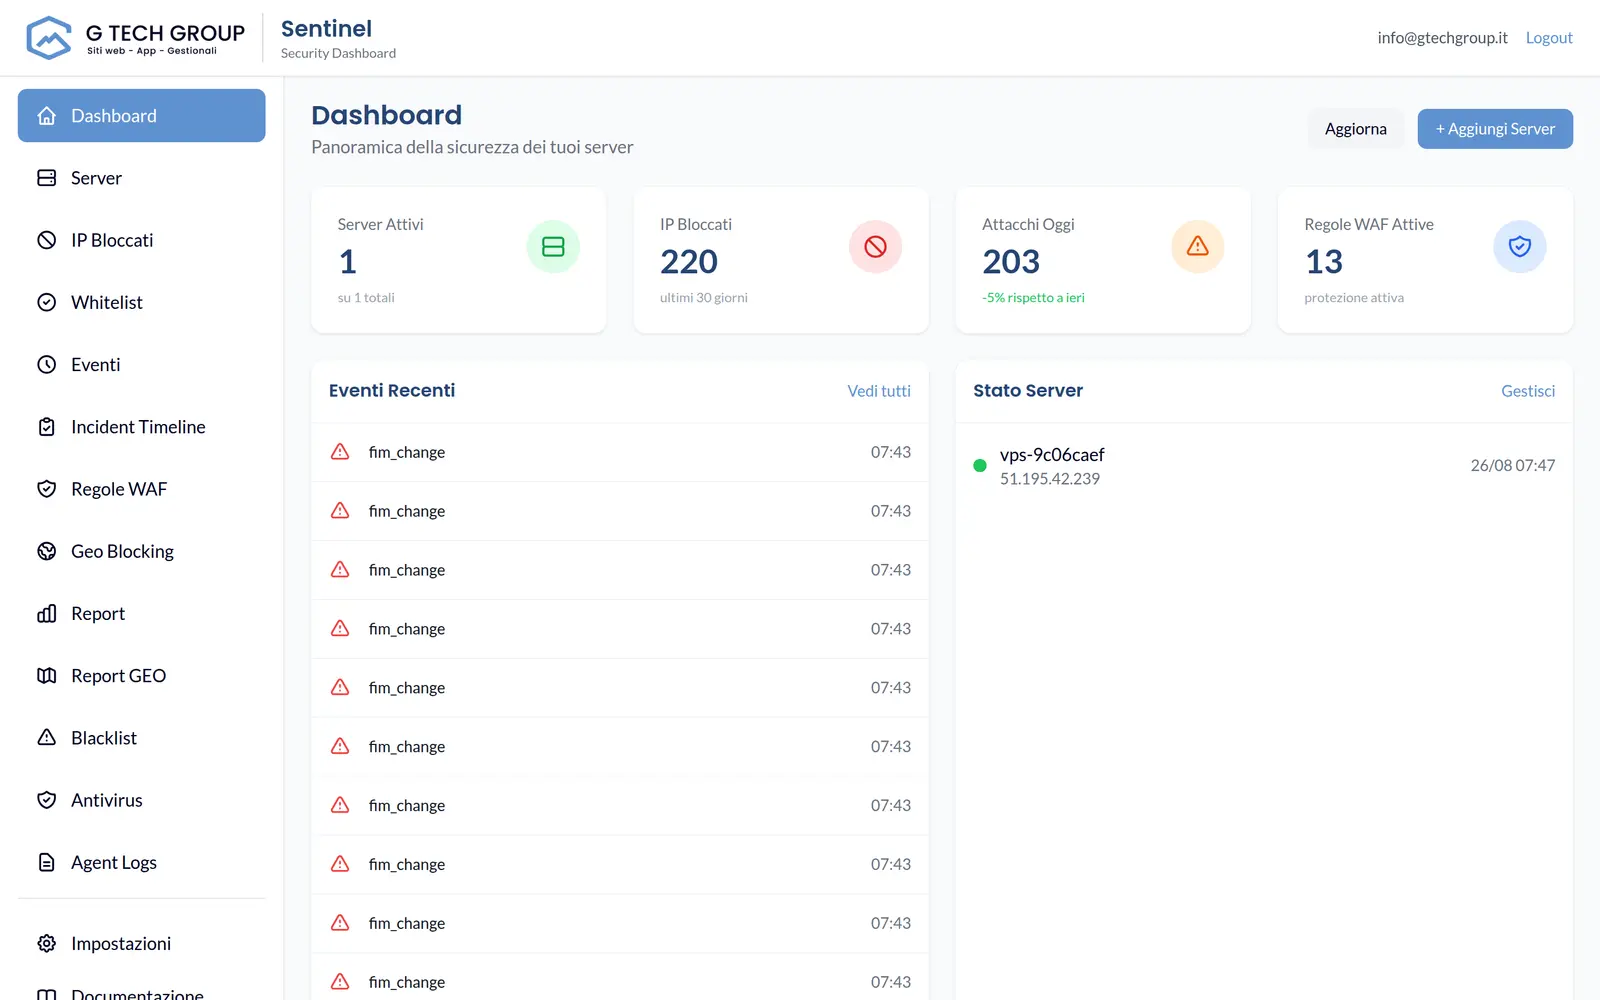
The dashboard updates automatically: the events of the entire fleet flow with an automatic refresh every few seconds, without reloading the page. See WAF blocks, stopped IPs, SSH attempts and threshold crossings as they happen.
Aggregated fleet logs
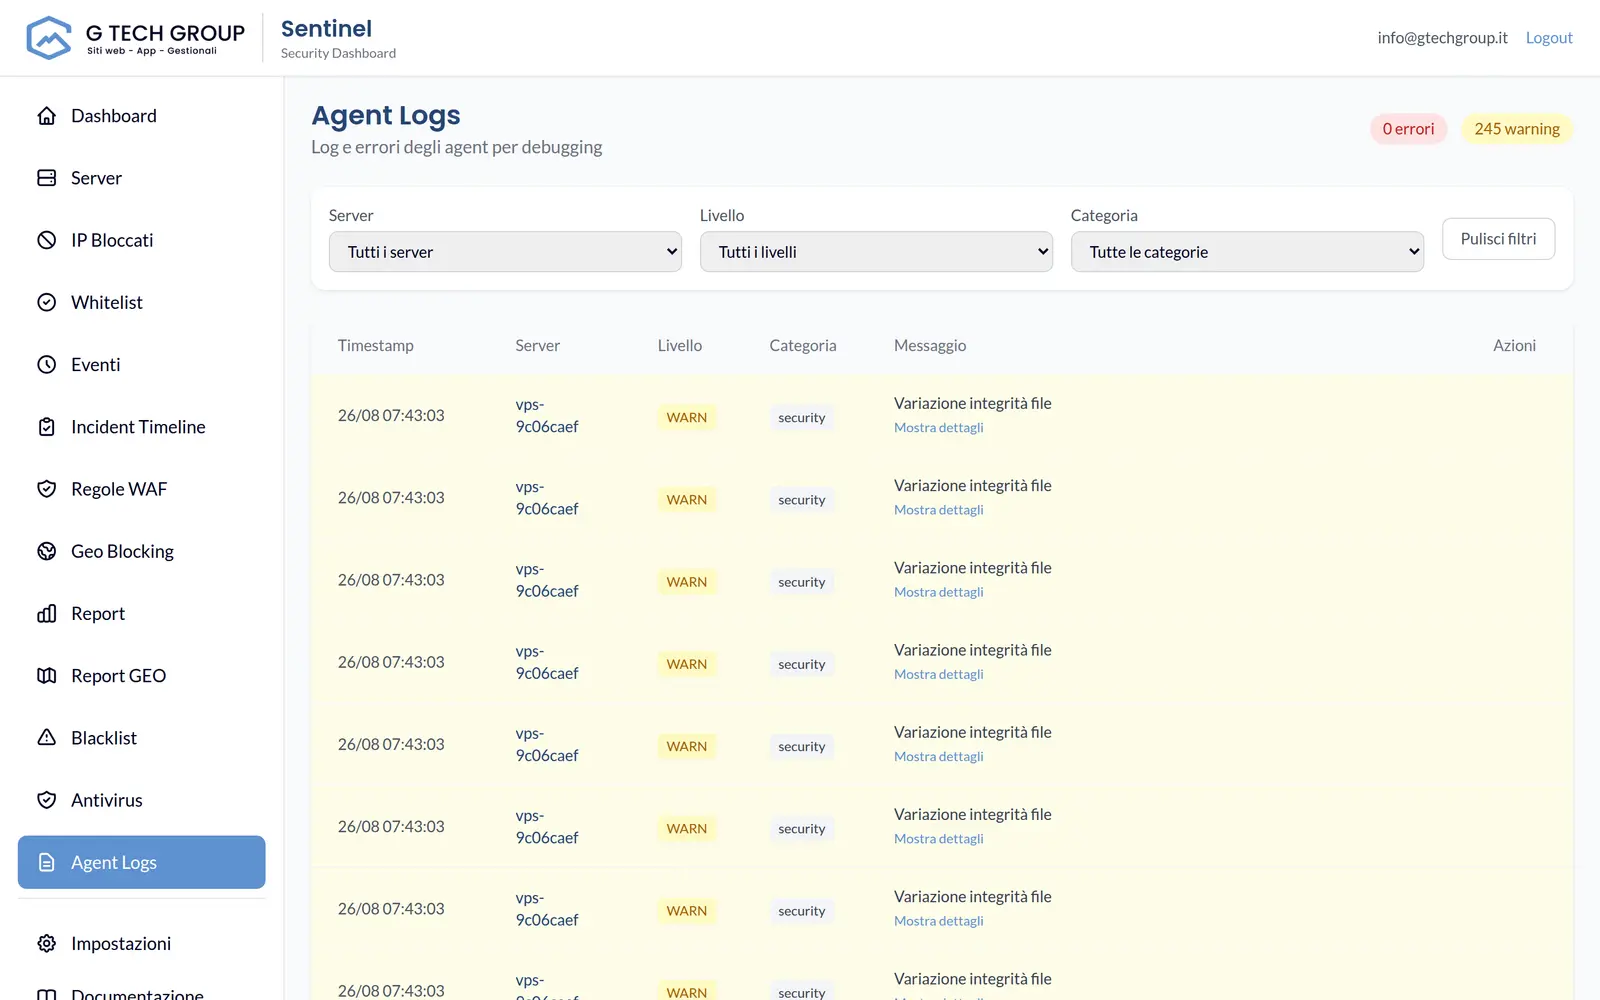
Each agent sends its own logs in batch via gRPC (SubmitLogs) to the central server, which collects them in the table agent_logs. On the /logs page you can filter, count and open the JSON detail of each line, with anti-flood per-server to avoid drowning in noise.
Alert push ntfy + Android app
The server generates a self-hosted ntfy push notification (topic + token, with priority and tags) at the moment a critical event is triggered. It is the real-time channel: the dashboard is updated by itself, but the push notification is what alerts you on your phone.G Tech app for Android is a ntfy client that also consults the APIs.
Incident timeline, reports & geography
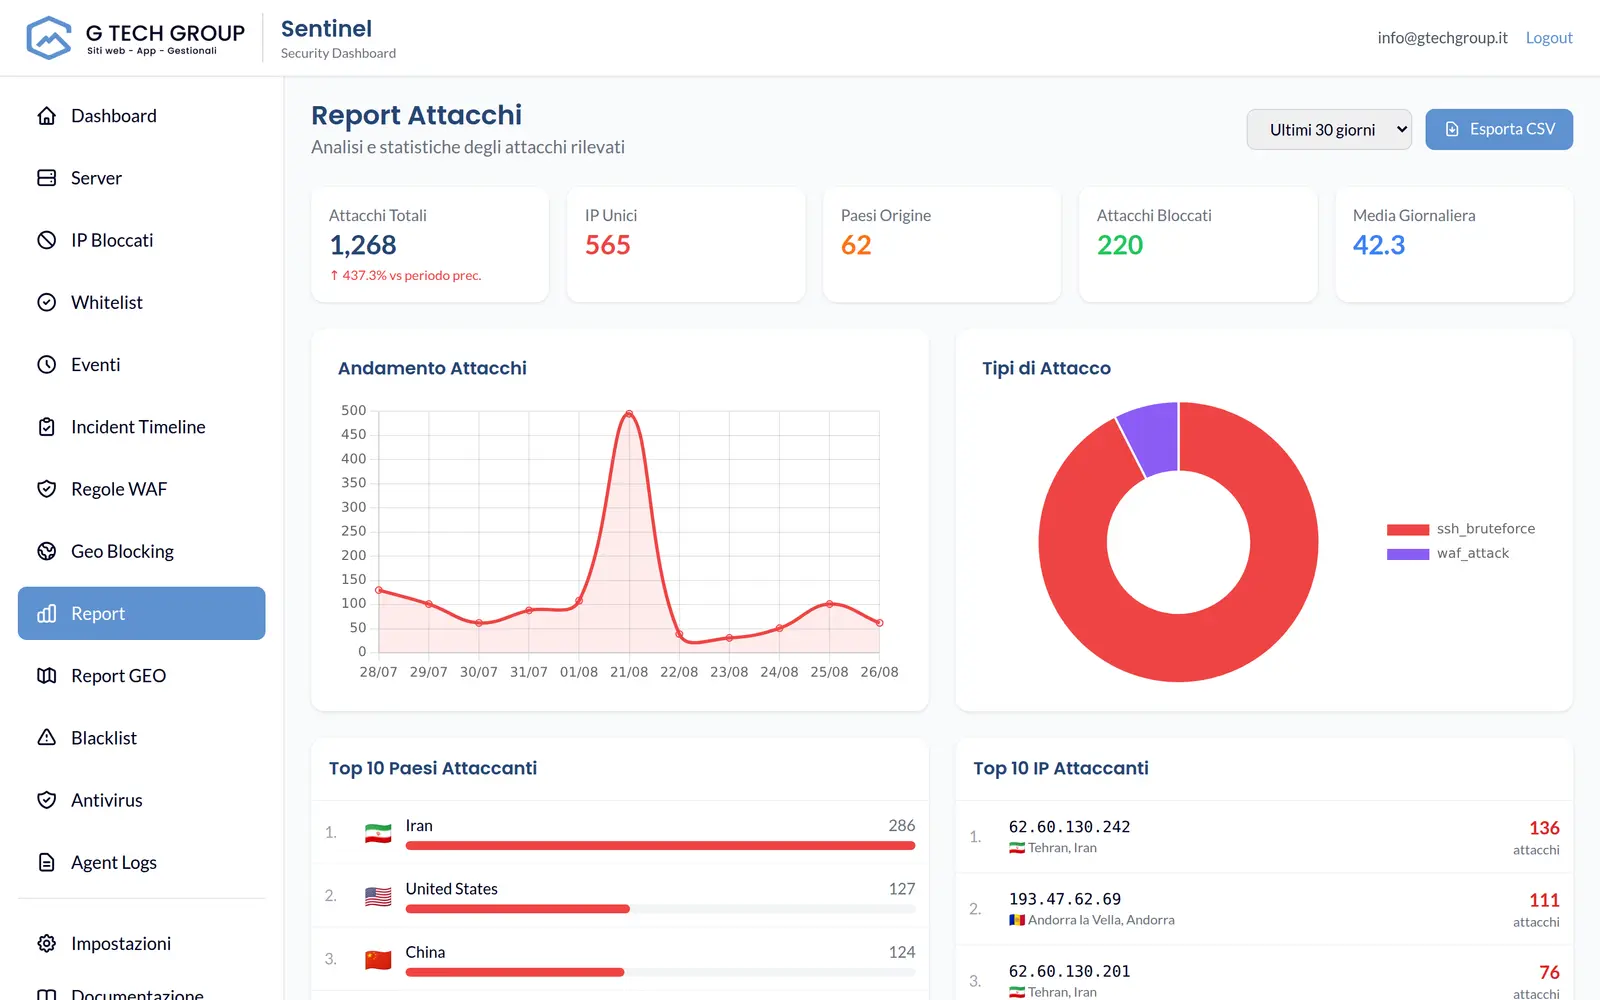
Rebuild an incident, analyse periods from 7 days to 1 year and export data. Periodic summaries can be delivered via ntfy and, when configured, also by email.
For each address, open the full history: WAF events, blocks, attempts and actions undertaken, with geolocation, ISP and current status of the block.
Choose 7, 30, 90 or 365 days and compare total, average, attack types, top sources, countries and providers. The recent timeline is filterable and exportable in CSV.
View countries, cities and ISPs of origin, open the details of a country and compare attack counts and unique IP addresses.
Receive a daily or weekly summary via ntfy; the server also has an SMTP mailer report for delivery via email when configured.
Metrics & Prometheus
Both the server and agents display metrics in Prometheus 0.0.4 format. The server's /metrics endpoint is bound to 127.0.0.1 • not publicly exposed • while each agent publishes on :9100, ready to be scraped by your Prometheus.
Frequently asked questions
No, and it's right to be honest: the dashboard is updated with automatic HTMX polling every ~30 seconds, without reloading the page. The real-time channel is the push ntfy, which the server generates at the exact moment of the event.
Alert push can travel on ntfy self-hosted, using your own server, topics and tokens. If you enable emailing, the message instead passes through the SMTP server you have configured.
Events filter by server and type (waf_block, ip_blocked, ssh_failed, rate_limit...). Fleet logs can be filtered by Server, Level (error/warn/info) and Category (update/security/system/network) with counters and JSON details.
The server only marks an offline agent after a debounce of about 90 seconds: Network micro-interruptions do not generate false alarms. When the agent returns, you receive the back-online notification.
Yes, if the SMTP mailer report is configured. Alternatively, the daily or weekly summaries arrive via ntfy and in the Android app. The full report is always available and exportable from the panel.
Yes. The metrics use Prometheus format 0.0.4: the server displays them on 127.0.0.1 (local bind, not public) and each agent on :9100, ready for scraping from your Prometheus.
We show you Sentinel's dashboard live on your infrastructure and configure alerts and custom reports.